Q2 2018 Insights
The second quarter brought renewed strength in U.S. equities, which posted gains on the heels of modest losses earlier in the year. U.S. stocks were the clear leaders of the quarter, significantly outperforming international equities, which declined in U.S. dollar terms, as well as key fixed-income indices, whose returns were mainly flat to negative.
The mixed performance of the global financial markets reflected the divergent paths of economies, corporate profits, and central bank policies. In the United States, GDP and earnings growth accelerated, inflation increased, and the Federal Reserve continued to raise interest rates and unwind its balance sheet. Overseas, economic activity in China showed signs of slowing, and profit growth moderated (albeit from high levels). Inflation was generally soft in developed international economies, and major foreign central banks remained accommodative. With stronger growth and higher interest rates in the United States, the dollar rallied, lowering the returns of international securities for U.S.-based investors.
A host of geopolitical uncertainties weighed on investor sentiment during the quarter, including protectionist trade policies and rhetoric, political stresses in the eurozone, and approaching elections in Mexico and Brazil. By and large however, the threat of tariffs and trade wars was the main story that reverberated across global financial markets during the quarter. However, as we will discuss throughout this letter, the impacts varied in orders of magnitude from asset class to asset class. Areas of the market that are more insulated from international revenue and/or supply chains fared better, while investors may have overreacted in others. Regardless of political inclinations, it is important to remember that the world’s economies are deeply integrated. The global trade system, while imperfect and in need of improvement, is fragile; any changes should be thoughtful and measured.
Despite the unsettled geopolitical backdrop, volatility (as measured by the VIX Index1) remained below its long-term average throughout much of the quarter after having spiked in February (see Appendix A). We expect volatility to rise to more normal levels in the coming months, particularly as global central banks reduce the flood of liquidity that has supported asset prices over the past several years. Should normal volatility return to the markets, differentiation between and within asset classes should also increase, creating a favorable environment for active management.
Financial Markets Performance
Equities
U.S. equities registered positive returns in the second quarter (see Exhibit 1), lifted by robust economic fundamentals and better-than-expected corporate earnings. The small-cap Russell 2000 Index performed especially well, as the domestic focus of many smaller companies shielded their stocks from worries about global trade. According to FactSet2, companies in the Russell 2000 Index derive an estimated 78% of their revenues from the United States, compared to only 62% for companies in the S&P 500 Index.
Returns for U.S. growth and value stocks were positive across all major market capitalization segments. On a comparative basis, small-cap value shares outperformed small-cap growth shares for the first time since the fourth quarter of 2016; however, large-cap growth equities continued to substantially outperform their large-cap value counterparts. Over the past year, large-cap growth stocks have led large-cap value stocks by approximately 16 percentage points3, reflecting the divergent performance of two of the largest sectors in the S&P 500 Index: technology and financials. The growth-oriented technology sector (26% of the Index) returned 31.3% during the 12 months ended June 30th, while the value-oriented financials sector (14% of the Index) returned only 9.7%. While momentum in the short term has supported growth stocks, we believe their valuations have become extended, and we are tactically rebalancing toward value stocks.
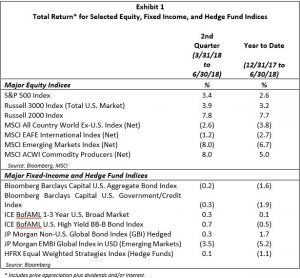
In the second quarter, energy was the best-performing sector of the U.S. equity market, posting a double-digit increase as oil prices rallied. The consumer discretionary and technology sectors also performed quite well, driven by strong gains in the “FAANG” stocks (Facebook, Apple, Amazon, Netflix, and Google). Collectively, these five stocks represent nearly 15% of the S&P 500 Index and contributed 83% of the Index’s return during the first half of the year. In contrast, industrials and financials registered losses and were the worst-performing sectors of the U.S. stock market during the same period. Worries about trade tariffs weighed on industrials, while financials were hurt by a flattening in the Treasury yield curve, which tends to dampen banks’ profit margins.
After outperforming in 2017, international stocks lagged U.S. stocks for a second consecutive quarter, pressured by trade uncertainties and a broad strengthening in the U.S. dollar. Despite the dollar headwind, developed international markets produced a small gain in local currencies, supported by generally stable economic growth and accommodative monetary policies in Europe and Japan. Emerging market equities were significantly weaker due to several factors, including concerns about a trade war, currency movements, softness in Chinese economic data, labor strikes that paralyzed Brazil’s economy, and concerns about large current-account deficits in Turkey and Argentina.
Fixed Income
The Fed raised the target for its main policy rate in June to 1.75% – 2.00%, as expected, and signaled two more rate hikes by the end of the year. The Fed’s policy tightening put upward pressure on short-term U.S. Treasury yields, with the two-year yield touching its highest level since 2008. Long-term Treasury rates also increased, although not as much as short-term rates, causing the yield curve to continue to flatten.
Despite the negative effect of rising interest rates, the U.S. Treasury market posted a slightly positive total return for the quarter because of coupon income. Returns in overseas sovereign debt markets were mixed. Most countries eked out small gains in local currencies, led by Germany and France, however, Italian securities experienced a sharp selloff after the president’s decision to block the formation of a new anti-euro government.
Returns for investment-grade corporate bond indices in the United States, the United Kingdom, and the eurozone were all negative in local currencies. Corporate fundamentals generally remained solid; nonetheless, markets declined due to trade uncertainties, expectations that U.S. interest rates would continue to rise, and investors’ weak appetites for risk. The European high-yield bond market also registered a loss, impacted by concerns about the political environment in the eurozone. In addition to the turmoil in Italy, disagreements in Germany over the country’s immigration policy threatened the stability of its governing coalition. U.S. high-yield fixed income fared better, advancing amid healthy corporate earnings growth, a relatively light volume of new supply, and attractive levels of income.
In emerging markets, both U.S. dollar-denominated and local currency debt registered negative returns. Emerging market bonds faced the same headwinds that pressured emerging market equities, including appreciation in the U.S. dollar, protectionist trade policies, and unfavorable country-specific developments. Despite the negative sentiment on the asset class as a whole, debt markets in Mexico, Chile, and Colombia delivered positive total returns in their respective local currencies.
Global Economic Outlook
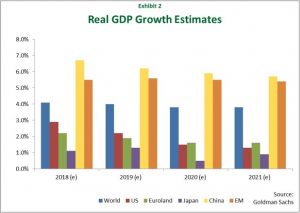
The global economy is expected to grow over the long term at a solid pace, led by emerging markets (see Exhibit 2). However, the synchronized acceleration in growth that we witnessed last year seems to be fading, as more economies enter the mid-to-late stages of the business cycle. For example, relatively few of the world’s largest economies are experiencing a pickup in manufacturing activity following several years of broad-based improvement (see Appendix B). Additionally, global trade, which began to weaken in the spring (see Appendix C), could slow further because of tariffs that went into effect in June and July. Manufacturing-based export countries, such as Germany and South Korea, are particularly vulnerable to greater protectionism, and certain sectors of the U.S. economy also depend on global revenues and supply chains, including technology (see Appendix D).
United States
After rising 2.2% in the first quarter of the year, U.S. economic growth increased at a 4.1% annual rate in the second quarter, boosted by fiscal stimulus. Consumer spending rose substantially, exports and government outlays increased, and business investment remained strong. We expect the impact of lower corporate and personal tax rates, as well as increased government spending to continue to drive healthy rates of U.S. GDP growth over the next several quarters. That said, we believe expansionary fiscal policies will have diminishing returns after a year or two, since the economy is already operating at its full potential. Conditions in the labor market are tight, and factory utilization is at a multi-year high.
While we expect the second-longest U.S. expansion on record to continue over the near term, our positive outlook is tempered by the knowledge that the future direction of growth becomes less certain as the business cycle matures. Rising inflation is one of our concerns, as price pressures have been building across a broad range of goods and services. Although key measures of inflation are still below their long-term averages (see Appendix E), the combination of fiscal stimulus, tight labor and operating capacity, and new trade tariffs could cause inflation to accelerate. We also see the potential for U.S. government policy, particularly with respect to trade, to undermine business and consumer confidence, which could slow economic growth.
The continued flattening of the U.S. Treasury yield curve remains a popular topic in the financial press. The curve still has an upward slope (i.e., short-term rates are below long-term rates), but there are worries that it might invert (i.e., short-term rates rise above long-term rates). An inverted yield curve has been a reliable leading indicator of recessions over the past few decades. However, recession is not an immediate consequence of an inversion, and given the current fundamentals of the U.S. economy, we believe the risk of recession in the next 12-18 months is low.
Europe and Japan
Following last year’s performance, the strongest in a decade, the eurozone economy has lost some of its positive momentum, and several factors suggest that growth could continue to slow. Tariffs imposed by the United States on European steel and aluminum exports in June will likely pressure growth, and the rise of populism across the region could exacerbate trade tensions with the U.S. Populist politics are also creating new obstacles to immigration and eroding confidence in the stability of the European Union (EU). Despite these challenges, the eurozone economy appears on track for moderate growth, supported by declining unemployment, resilient consumer spending, and strong demand for credit. The European Central Bank has pledged to keep interest rates at record lows through next summer, but announced plans to end its quantitative easing program in December.
The U.K. and Japanese economies are expected to continue to underperform most other developed economies this year, although growth should remain positive. In the United Kingdom, persistently weak productivity growth is limiting the economy’s ability to expand, while inflation has been elevated due to the weakness in the pound. Additionally, business investment is likely to remain weak given the continued uncertainty surrounding the June 2016 “Brexit” referendum. There is speculation that the U.K. government will ask the EU for an extension of the two-year Brexit negotiating period, which ends on March 29th, 2019. While this would give businesses more time to prepare for a new regulatory regime, it would prolong the uncertainty that has been overshadowing the U.K. economy for the past two years.
Similar to the U.K., a shortage of labor is constraining economic growth in Japan. Japan’s unemployment rate is at a 25-year low of 2.4%, and the job availability ratio recently rose to its highest level since 1974, with 162 job openings for every 100 workers. To boost its labor force, the government announced plans to broaden its immigration policy to accept more unskilled foreign workers, a change that lawmakers could approve later this year. Meanwhile, the potential for wage growth could help lift core inflation, which is still well below the Bank of Japan’s (BOJ) 2% target. The central bank, which has been focused on keeping the yield on 10-year government bonds near zero, said at its July policy meeting that it would allow yields to rise as high as 0.2%. However, the BOJ otherwise maintained its ultra-loose policies and will likely remain very accommodative given low inflation, weak growth, and a new deputy governor known as an advocate of aggressive easing. Fiscal policy in Japan has also been supportive of the economy ahead of a value-added tax increase slated for October 2019.
Emerging Markets
Emerging economies appear poised for strong growth in 2018 and beyond, bolstered by the rise of the middle class (see Appendix F), which should contribute to higher levels of domestic consumption. The outlook is particularly strong for India now that the negative effects of 2016-2017 government reforms, aimed at strengthening tax collection, have faded. Manufacturing activity in India rose to a six-month high in June, and the service sector of the economy also accelerated, driven by improvement in both outstanding and new business orders.
China’s growth has fallen behind that of India’s, in part due to policies designed to control excesses in certain areas of the economy, namely the industrial and shadow banking sectors. Nonetheless, growth should remain strong, and the central bank, which has lowered bank reserve requirements three times this year, is expected to introduce additional easing measures. While much attention has been paid to the impact U.S. trade policy will have on China’s economy, we believe these concerns are overstated. China has been transforming itself from an export-led to a consumer-led economy, with domestic consumption accounting for 78.5% of GDP in the first half of 2018, compared to only 45.2% in the first half of 20134. It is estimated that the tariffs implemented thus far will trim China’s growth rate by a mere 0.1%, from 6.8% to 6.7%5.
In Latin America, forecasts for 2018 Brazilian GDP growth have been declining in response to weak economic indicators and political unrest ahead of the October presidential elections. That said, the first quarter of the year marked Brazil’s fifth straight quarter of expansion, and while current growth is muted, the economy is expected to accelerate in 2019 and 2020. In Mexico, the election of Andrés Manuel López Obrador has shifted the country noticeably to the left. Furthermore, with a majority in both the Chamber of Deputies and the Senate, he has spoken about making changes to the constitution, including lifting protections for elected officials and establishing a constitutional right to free education. López Obrador’s strong campaign rhetoric raised concerns about his policy agenda among business leaders and investors, but since winning the election, he has struck a more balanced tone.
Investment Strategy
Equities
The reduction in the U.S. corporate tax rate from 35% to 21% has led to substantially higher profits for domestic companies. As a result, the U.S. stock market now looks fairly valued relative to long-term averages (see Appendix G). Nonetheless, we believe international equities still appear more attractively valued than U.S. stocks and continue to prudently overweight active non-U.S. equity strategies, where appropriate.
As the Fed gradually removes liquidity, sectors of the market and individual stocks are behaving differently, rather than moving in close lockstep. This is providing our active fund managers with more opportunities to purchase high-quality stocks at attractive prices. As part of our disciplined rebalancing process, we continue to modestly reduce exposure to segments of the market that have performed especially well relative to other segments, such as some growth stocks, where appropriate.
Fixed Income
Fixed income continues to look more fully valued than equities since, even though interest rates have increased in the past year, they remain low by historical standards. However, as part of the rebalancing process, we are slightly increasing exposure to fixed income (where appropriate) to moderate overall portfolio volatility and provide for liquidity requirements. In doing so, we continue to emphasize shorter-duration and flexible, unconstrained strategies to better protect against declining bond prices, but also to take advantage of increasing coupon payments. We believe this is a prudent approach to managing a fixed-income allocation, as the Fed is likely to continue increasing rates and reducing the size of its balance sheet, particularly now that inflation is rising.
In Closing
As we look ahead to the next few quarters, we are optimistic in our outlook for the global economy and financial markets. The current global expansion is showing signs of maturing, yet growth is expected to remain strong in the United States and emerging markets, and positive across other developed economies. In addition, companies around the world are reporting robust earnings growth. Geopolitical issues and reduced global liquidity could drive up volatility to more normal levels as the year progresses. However, the solid economic and fundamental backdrop should continue to be supportive of financial markets.
The uneven performance of major asset classes so far this year reinforces the importance of maintaining broad diversification, and we continue to thoughtfully rebalance portfolios to ensure diversification by asset class, geographic market, asset size, and investment style. As always, we remain focused on achieving your long-term investment objectives, within your risk profile, and funding your future liquidity needs.
Please call us at +1 (301) 881-3727 if you have any questions about your portfolio, or if you would like to notify us of any changes in your circumstances.
Sincerely,
The SOL Capital Management Team
1The VIX Index is a measure of market expectations of near-term volatility conveyed by S&P 500 Index option prices.
2FactSet is a provider of financial information and analytics to the investment management industry.
3As measured by the Russell 1000 Growth and Russell 1000 Value indices.
4Sinology, “Is China Tanking?” 16 July 2018, Matthews Asia.
5Sinology, “Battlefield Choices,” 2 July 2018, Matthews Asia.