
Q3 2018 Insights
While the third quarter saw a relatively calm environment for equities, especially U.S. stocks, in hindsight it was the “calm before the storm.” Most third quarter and year-to-date gains (again, especially for U.S. stocks) were reversed over the course of a few weeks in October. Before discussing market returns in more detail, we would like to address some of the causes of the recent market volatility, as well as how we approach investing in such times.
As we have mentioned in many Client Investment Letters over the past few years, volatility in equity markets has been abnormally low. Historically, the VIX Index that tracks market turbulence has averaged around 20, but recently it has hovered at nearly half that value. During the third quarter, the S&P 500 Index did not have a single day in which it moved more than 1% (up or down). That is not normal.
Volatility is uncomfortable and unnerving to many investors, but it is also an inherent component of equity investing. With the free and rapid flow of information, markets react almost immediately to positive (or negative) headlines around an earnings call, a rating agency’s up- or downgrade, a change in government policy, or any other issue that may affect the intrinsic value of a company. Many times, however, market participants overreact, both to the upside and downside, and extrapolate the positives (or negatives) of one company, sector, or country to the market overall. As more information and analysis enters the marketplace, the euphoria (or fear) subsides and prices adjust to closer approximations of companies’ “true” values. This is how free, fair, and efficient markets are supposed to function.
However, the volatility inherent in equity investing is a key reason why we emphasize to clients that their portfolios’ asset allocations should be consistent with their investment objectives, time horizon, and liquidity needs. Equity investments should be for the long term; while equities provide higher potential returns, investors must accept a bumpier ride along the way. Assets that are needed in the near term should not be exposed to these higher levels of volatility, which is why we maintain fixed income allocations for clients in such situations. If your investment objectives, time horizon, or liquidity needs have changed, please contact us so we can ensure your portfolio is appropriately constructed to fit your needs.
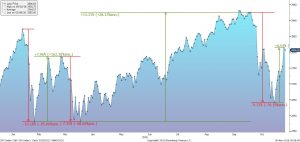
Going forward, at least in the short run, we would not be surprised if volatility levels were to remain elevated. Again, we want to highlight that this is not unusual. Markets experienced a similar correction as recently as February, followed by a more modest pullback in March (see Exhibit 1). When there are steep selloffs in equity markets, many investors, understandably, recall the financial crisis of 2008. While it was a truly traumatic moment for global financial markets, ten years later, we do not believe we are facing similar circumstances. We do not see the same excesses in the global economy we saw then, and the global financial system is much healthier thanks to steady recapitalization and stricter supervisory standards.
Financial Markets Performance
Equities
Major U.S. stock market indices posted strong gains in the third quarter, climbing to record highs amid robust growth in the economy and corporate profits. Companies in the large-cap S&P 500 Index and the small-cap S&P 600 Index reported year-over-year quarterly earnings growth of 25% and 27%, respectively, driven in part by lower corporate tax rates. Top-line revenues were also strong, increasing approximately 10% for large and small companies alike. Although all sectors of the U.S. stock market ended the quarter in positive territory, there was significant divergence by style, with U.S. growth stocks strongly outperforming U.S. value stocks across the capitalization spectrum, continuing a nearly two-year trend of growth stock leadership.
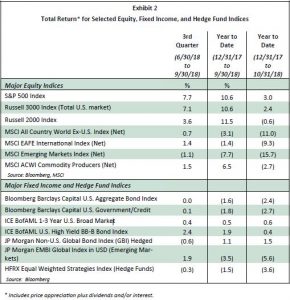
However, as global markets sold off in October, there were few safe havens for investors to flee from increased volatility (see Exhibit 2). Yet, as of October 31, U.S. large-cap stocks were still positive for the year, but the dynamic that drove returns through September had broken down. The same growth stocks, specifically technology and consumer names, which had dominated returns of the S&P 500 were some of the hardest hit investments as the market began to question their extended valuations in a rising interest rate environment. Growth stocks in the S&P 500 sold off 8.1% in the month of October versus a decline of 5.3% for the index’s value component.1
Higher risk small-cap stocks were also hit hard, weighed down by relatively higher debt levels and greater susceptibility to rising wage inflation in the U.S. In small-cap, growth stocks also took a heavier beating, dropping 12.7% in October versus 9.0% for value stocks.2
International equities advanced during the third quarter in U.S. dollar terms, thanks to the positive performance of developed markets. Japanese stocks did especially well, in part due to easing trade tensions. Japan signed a trade agreement with the European Union (EU) and agreed to start negotiations with the United States, alleviating fears of U.S. tariffs on Japanese auto exports. European stocks finished the quarter slightly higher, but markets have since been pressured by evidence that global trade tensions are affecting manufacturing activity and business confidence. Worries about Italy’s fiscal position and continued uncertainty surrounding the outcome of the “Brexit” negotiations also weighed on European shares.
Emerging market equities have been held down, as the continued U.S.-China trade dispute, a stronger U.S. dollar, and rising U.S. interest rates dampened risk appetites. Much of the weakness occurred in August, when the financial troubles of Turkey and Argentina sparked broader concerns about emerging market countries and companies that rely on overseas funding. However, we do not believe there is a high risk of contagion throughout all emerging markets as the financial troubles plaguing these two countries are specific to their respective political, economic, and financial situations.
Fixed Income
U.S. Treasury yields remained on an upward trajectory during the third quarter, rising across maturities in response to positive U.S. economic news, ongoing monetary tightening, and the growing borrowing needs of the federal government. Short-term yields continued to increase faster than long-term yields, leaving the difference between two- and 10-year rates at a mere 0.24% on September 30th, the lowest since 2007. The move in short-term yields was driven by the actions of the Federal Reserve, which raised its key policy rate 0.25% for the third time this year and projected several more increases by 2020. Demand for longer-term bonds from insurance companies, pension funds, and overseas buyers helped contain yields at the long end of the Treasury curve.
In the rising rate environment, the U.S. investment-grade bond market delivered an essentially flat performance, with losses in Treasuries and mortgage-backed securities offsetting gains in other sectors. Corporate credit, which generated a total return of approximately 1.0%, was the best-performing sector of the investment-grade market, supported by strong fundamentals and coupon income. High-yield U.S. corporate securities fared even better, in part due to their relatively lower sensitivity to interest rates. The rally in oil prices was also beneficial, since approximately 15% of the high-yield bond market consists of issuers in the energy sector.
Non-dollar-denominated bonds generally weakened during the quarter, as the U.S. dollar appreciated against most currencies. In addition, the Bank of England raised interest rates, the European Central Bank confirmed its plan to end its bond-buying program in December, and Italian bond yields spiked after the government unveiled a larger-than-expected 2019 deficit target. A sharp selloff in the Argentine peso and Turkish lira versus the U.S. dollar contributed to a volatile quarter for emerging market bonds. Nonetheless, key emerging market bond indices ended the period with gains, as prices rallied strongly in September.
During the global market selloff in October, intermediate duration bonds, as expected, fared better than riskier high-yield bonds. However, returns of the Bloomberg Barclays Aggregate Index, the primary benchmark for intermediate duration, or “core” fixed income strategies, were still slightly negative for the month because of the rising rate environment. Shorter duration strategies were able to register a small gain in October.3
Global Economic Outlook
The global economy continues to expand at a solid pace, and growth is expected to remain positive across most developed and emerging markets for the next several quarters (see Exhibit 3). That said, a number of major economies, including the United States and China, have entered more advanced stages of the business cycle, suggesting that global growth will moderate over the next few years (see Appendix A). Signs that global manufacturing activity is cooling substantiate the view that economic momentum may have peaked in the current expansion (see Appendix B).
China’s economy continues to gradually slow, creating headwinds for countries that rely on exports to China, particularly commodity producers. Rising trade tensions present an additional challenge for global growth given the negative ramifications for export-oriented nations, such as Germany and South Korea. Meanwhile, global liquidity is tightening, political uncertainty remains elevated in Europe, and U.S. dollar strength is making it more expensive for sovereign and corporate borrowers in emerging markets to service their dollar-denominated debt.
Despite these issues, the growth outlook for the global economy remains positive. Growth and inflation are stable in the United States, and policymakers in China are beginning to take a more accommodative approach to their economy. Japan’s economy rebounded from a weak start to the year, domestic demand continues to be supportive of eurozone growth, and India is poised to surpass the United Kingdom as the world’s fifth-largest economy.

United States
U.S. GDP rose at a 3.5% annual rate in the third quarter, capping the strongest six months of growth in four years. Consumer spending (which accounts for approximately 70% of economic output) remained strong, a reflection of the lowest unemployment rate in nearly five decades. Government outlays increased the most since 2016, and a restocking of business inventories contributed meaningfully to growth.
As mentioned, we believe the domestic economy is on track for continued growth over the coming quarters. However, the United States has clearly progressed to a more mature phase of expansion following years of declining unemployment and firming wage growth. Inflation remains in check but is trending higher, and the combination of rising input costs and mounting wage pressure could begin to erode corporate profits. In addition, the positive effects of corporate tax cuts will eventually fade. There was a hint of this in the third quarter, when business investment grew at a much slower rate than it had in the first six months of 2018.
Rising trade barriers could also be problematic. The U.S. has imposed tariffs on more than $300 billion of imports this year, including $250 billion of Chinese goods, and China has retaliated by taxing $110 billion of U.S. products. These tariffs could exacerbate the late-cycle dynamics already at work in the economy by putting upward pressure on inflation (see Appendix C). Meanwhile, we expect the Fed to continue raising interest rates in the near term and unwinding its balance sheet, measures aimed at keeping inflation under control without unduly slowing growth.
China
China’s economy grew at slower-than-expected 6.5% annual rate in the third quarter on the heels of 6.8% growth in the first half of the year. Exports were resilient, aided by currency depreciation and efforts to ship products ahead of any further deterioration in U.S.-China trade relations. However, domestic demand was less buoyant than it had been in the prior year, and the pace of expansion in the manufacturing sector weakened.
Nevertheless, China is expected to meet its 2018 growth target of approximately 6.5%, and policymakers have taken steps to boost consumer spending and counter the impacts of tariffs. In October, the People’s Bank of China (PBoC) lowered the amount of reserves banks are required to hold for the fourth time this year. The PBoC is taking a targeted approach as it frees up capital, recommending to banks which industries and companies should receive loans to ensure that credit flows to borrowers with better investment prospects. With respect to fiscal policy, China is encouraging local governments to increase infrastructure spending and plans to cut personal income taxes in 2019. There is speculation of more easing ahead. However, China has repeatedly said that it will not resort to massive stimulus measures due to concerns about elevated levels of debt, particularly in the corporate sector (see Appendix D).
Investment Strategy
Equities
The U.S. stock market appeared fairly-valued relative to long-term averages at the end of the third quarter, and recent market volatility has pushed valuations lower. Earnings growth for U.S. companies should begin to normalize in 2019 once the short-term benefits of the tax cuts dissipate. Fading fiscal stimulus, combined with rising input and wage costs, could squeeze corporate profits. Nonetheless, the economic and earnings backdrop should remain supportive of stocks, and history has shown that U.S. equities can still produce gains in the later phases of the business cycle (see Appendix E).
We continue to rebalance portfolios, where appropriate, from growth strategies into value strategies in the U.S. Additionally, valuations remain more attractive overseas (see Appendix F). As a result, we continue to prudently overweight active non-U.S. equity strategies, where appropriate. Across the global stock market, we are favoring active fund managers that are able to take advantage of opportunities in less efficient markets.
Fixed Income
Given our expectations for more normal levels of volatility, we are modestly increasing exposure to fixed income, where appropriate, to help lower overall portfolio volatility and provide access to liquidity. We continue to emphasize short-duration and flexible, unconstrained fixed-income strategies, since we believe the Fed will remain on its current path of gradual rate increases and reductions to its balance sheet.
As always, we are adhering to our discipline by trimming exposure to areas we believe are overvalued and reinvesting in more undervalued assets, both in the United States and abroad. We expect mutual fund distributions to be higher than normal this year, and we will be using the majority of these distributions to further rebalance portfolios.
In Closing
Volatility returned in October as investors began to focus on various issues that had been apparent for some time. We did not observe any material changes in the economic or geopolitical backdrop and, except for a few areas of overvaluation, markets looked fairly-valued. Yet investor sentiment shifted abruptly, and the ensuing impact on asset prices was exaggerated by speculative market participants trading in derivative securities.
Given the positive fundamental backdrop, we do not view the recent volatility as a precursor to any major upheaval in the markets. The U.S. economy is performing well, allowing the Fed to continue gradually normalizing interest rates after years of unprecedented monetary easing. Overseas, officials in China are stimulating the country’s economy, and growth in the eurozone and Japan is expected to remain positive. Global growth may not be as robust and synchronized as it was a year ago, but the global economy and financial system are healthy. In this environment, companies across developed and emerging markets should still be able to post solid profit growth.
We invite you to call us at +1 (301) 881-3727 if you have any questions about your portfolio or current market conditions, or if you would like to notify us of any changes in your circumstances. It is changes in personal circumstances, not short-term market volatility, that should drive any adjustments to your long-term strategic asset allocation.
Sincerely,
The SOL Capital Management Team
1 As measured by the S&P 500 Growth Index and S&P 500 Value Index, respectively.
2 As measured by the Russell 2000 Growth Index and Russell 2000 Value Index, respectively.
3 As measured by the BofAML 1-3 Year US Broad Market Index.